Q&A
How it Works
Power (BI) refers to capabilities that enable organizations to make better decisions, take informed actions, and implement more-efficient business processes.
Create insightful reports & interactive dashboards across web & mobile devices
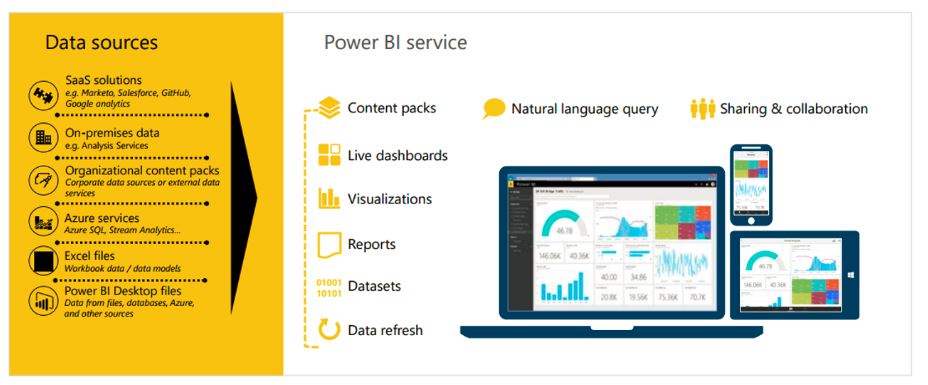
Power BI is a suite of business analytics tools that deliver insights throughout your organization. Connect to hundreds of data sources, simplify data prep, and drive ad hoc analysis. Produce beautiful reports, then publish them for your organization to consume on the web and across mobile devices. Everyone can create personalized dashboards with a unique, 360-degree view of their business. And scale across the enterprise, with governance and security built-in.
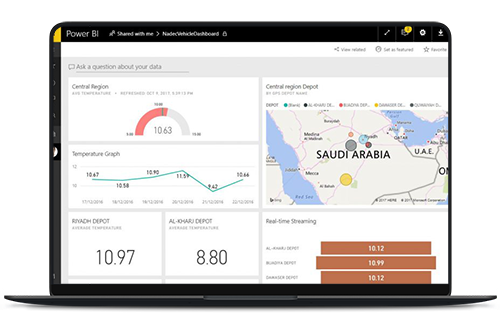
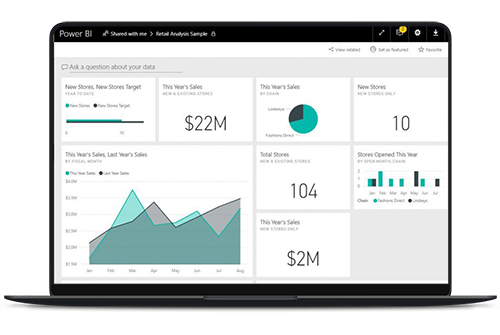
We help clients with Reporting and Dashboard visually presented on SharePoint Online platform. We use Power BI. PowerPivot and integrate with Excel, SQL Server, also with any 3rd party data sources such as Oracle and SAP.
Power BI is a suite of business analytics tools that deliver insights throughout your organization. Connect to hundreds of data sources, simplify data prep, and drive ad hoc analysis. Produce beautiful reports, then publish them for your organization to consume on the web and across mobile devices. Everyone can create personalized dashboards with a unique, 360-degree view of their business. And scale across the enterprise, with governance and security built-in.
We help clients with Reporting and Dashboard visually presented on SharePoint Online platform. We use Power BI. PowerPivot and integrate with Excel, SQL Server, also with any 3rd party data sources such as Oracle and SAP.
Quickly go from data to insight to action. Connect to hundreds of sources, prep data with ease, and create beautiful reports, all in minutes.
Always be in the know. View dashboards on the web or on your phone, get alerts when data changes, and drill into details. Your data is at your fingertips.
Simplify management, achieve compliance, and keep data secure while giving people access to the insights they need.
Business intelligence data is typically stored in a data warehouse built for an entire organization or in smaller data marts that hold subsets of business information for individual departments and business units, often with ties to an enterprise data warehouse.
BI programs often incorporate forms of advanced analytics, such as data mining, predictive analytics, text mining, statistical analysis, and big data analytics. Self-service business intelligence environments enable business users to query BI data, create data visualizations, and design dashboards on their own.

Q&A
Power (BI) refers to capabilities that enable organizations to make better decisions, take informed actions, and implement more-efficient business processes.
Q&A
Power (BI) refers to capabilities that enable organizations to make better decisions, take informed actions, and implement more-efficient business processes.
Q&A
Power (BI) refers to capabilities that enable organizations to make better decisions, take informed actions, and implement more-efficient business processes.
Copyright © 2020- 2021 Resemblesystems.com, All rights reserved.
Copyright © 2020- 2021 Resemblesystems.com, All rights reserved.
Copyright © 2020- 2021 Resemblesystems.com, All rights reserved.